
This page is dedicated to the immense amount of data collected and combed through, to accompany the book that highlights/outlines/exposes/spells-out the specific numbers that is/was collected to show proof and to support what will be/is in the book. If the data was included into the book, the book would be very VERY long and virtually impossible to understand due to the complexity and the endless amount of information.
Hopefully, this page on my website will allow the reader of the book (or veterans/family of veterans) to review the information collected, to see exactly what the politicians are up to in D.C. and how the proof is public record. My hopes is that this page will make it MUCH easier for anyone to grasp factual information, then fact-check it with the public records available at the click of the mouse, to trust the data I provide.
Congress.gov will have all of the sourcing proof for the provided data.
Legislation will have the bill information per Congress.
92nd to 117th Congressional Committee on Veterans Affairs Bills
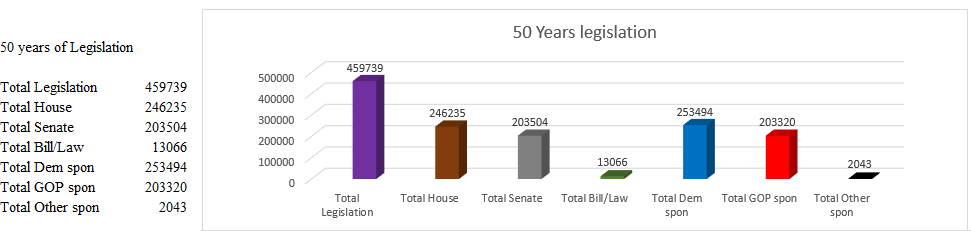
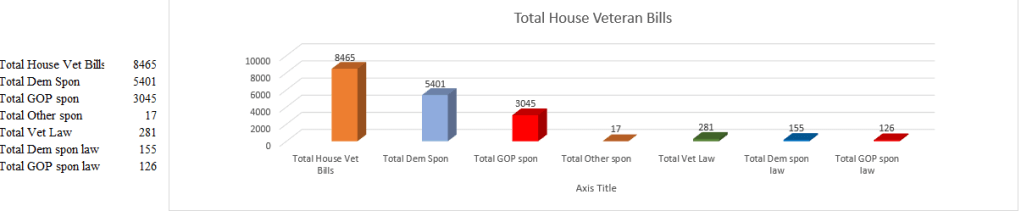
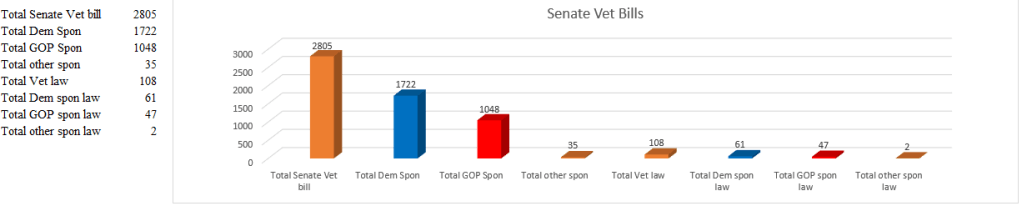
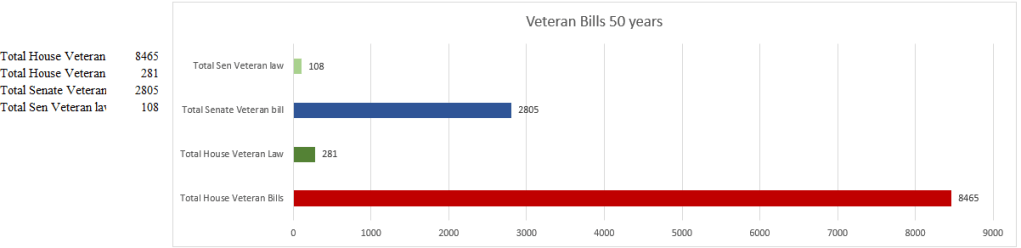
The following information encompasses the past 50 years of Congressional Committee on Veterans Affairs Bill information, graphs and statistics. This information currently is devoid of information from the 118th Congress due to it still being ‘active’ until 1 January 2025, when the 119th Congress takes effect.
This information is available for easier understand and sight-capturing data that will be outlined/highlighted/explained in the book. Having it here, rather than included in the book, saves the reader from over-introducing graphing and data outlines while trying to read the current information. Too much presented can/will take away from the main points, thus losing the interest of the reader.

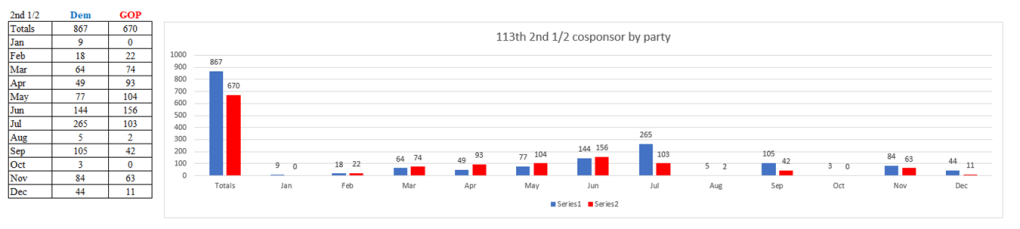
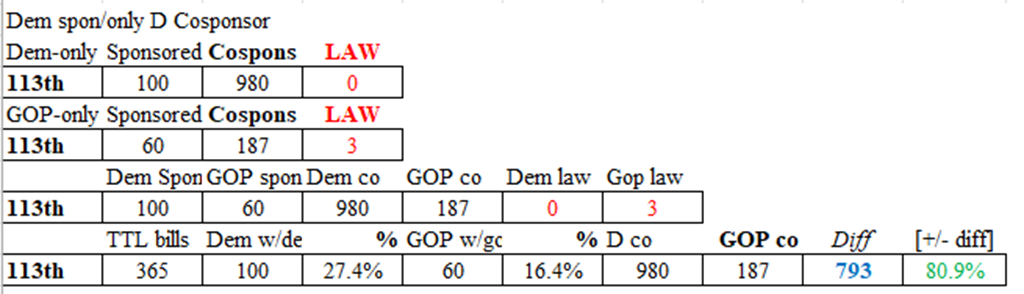
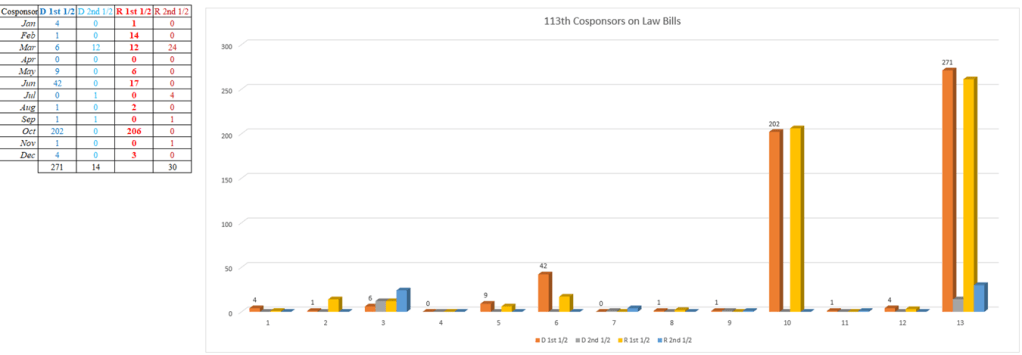
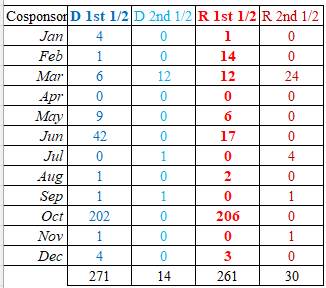
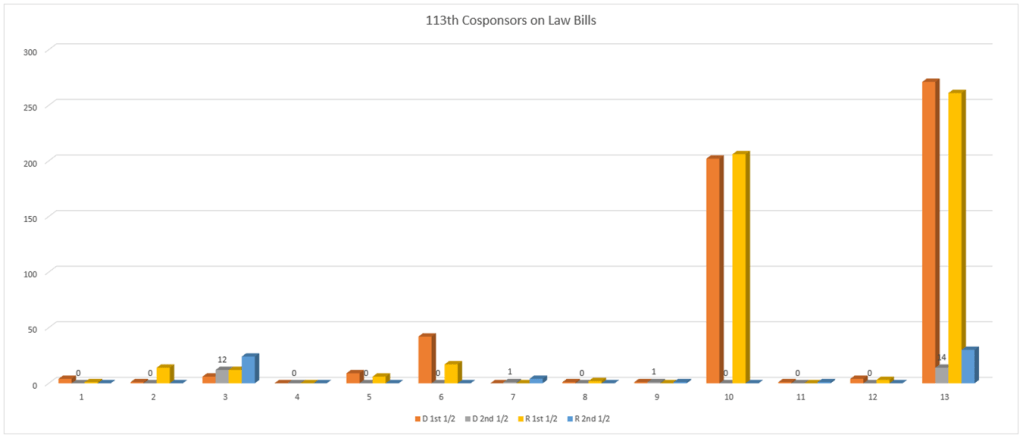


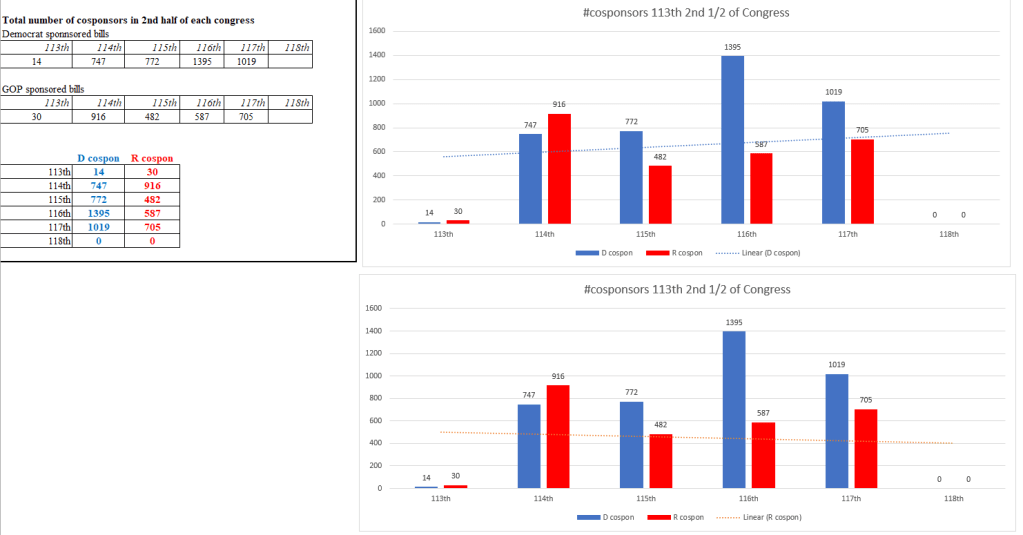
The above information is showing the number of cosponsors on each Congress (VA Committee specifically) during the 2nd half of the Congress term. The two graphs contain the same data and duplicated ONLY to show the trend line from each party and the direction that trend line travels.
The top graph highlights the consistent climb of Democrat cosponsor patterns during the 2nd half of the 113th Congress, while the bottom graph highlights the decline from GOP cosponsors.
It is important to identify and note patterns, to ask yourself why and what is this signaling?
[3 APRIL 2024] DATA from the 113th Congress to the 117th Congress: What states had the most proposed veteran-related bills in the 2nd half of their respective Congress? (Source: Congress.gov [each Congress: 113th, 114th, 115th, 116th and 117th])
Starting with the 113th Congress, the following shows The states that proposed the most bills and if any of those bills had advanced into law(s):
113th:
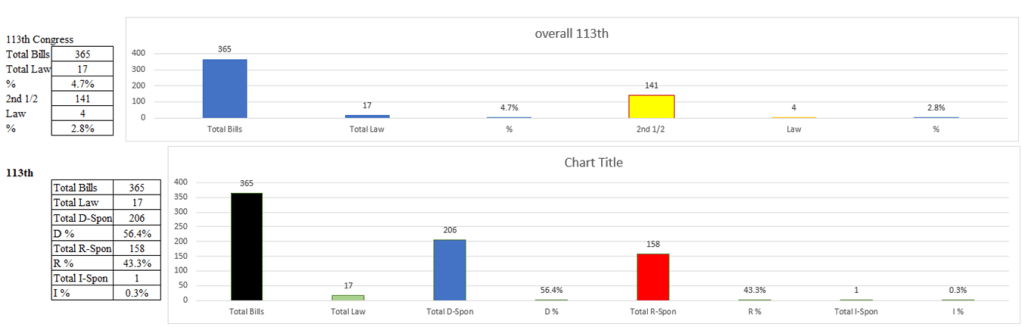
224 bills proposed in the 1st 1/2 of 113th and 141 in the 2nd half (VA Committee bills) for a total of 365 bills proposed. 207 Democrat, 157 GOP and 1 Independent sponsored/proposed bills in this Congress.
| 113th | 113th | ||||
| DEM: State | DEM: # Bills | DEM: # LAW | GOP: State | GOP: # Bills | GOP: # LAW |
| CA | 19 | TX | 7 | 1 | |
| AZ | 7 | FL | 7 | ||
| WA | 6 |
114th:
321 bills proposed in 1st 1/2 of 114th Congress VA Committee, and 131 proposed in the 2nd 1/2. Democrats proposed 225 and GOP 227 veteran related bills. In the 2nd 1/2 of the 114th, Democrats had 4 bills total, advance into laws and the GOP had 9.
| 114th | 114th | ||||
| DEM: State | DEM: # Bills | DEM: # LAW | GOP: State | GOP: # Bills | GOP: # LAW |
| TX | 13 | FL | 16 | 4 | |
| CA | 12 | 1 | CO | 7 | 1 |
| FL | 4 | OH | 6 | ||
| NY | 4 | TN | 4 | 1 |
115th:
345 bills proposed in the 1st 1/2 of 115th and 133 proposed in 2nd 1/2 of the 115th Congress VA Committee. The GOP-proposed bills had 4 advance into laws.
| 115th | 115th | ||||
| DEM: State | DEM: # Bills | DEM: # LAW | GOP: State | GOP: # Bills | GOP: # LAW |
| CA | 15 | FL | 7 | 1 | |
| CT | 6 | OH | 7 | ||
| PA | 6 | MI | 4 |
116th:
364 bills proposed in the 1st 1/2 of the 116th and 210 in the 2nd 1/2. Democrats had 5 bills advance into laws.
| 116th | 116th | ||||
| DEM: State | DEM: # Bills | DEM: # LAW | GOP: State | GOP: # Bills | GOP: # LAW |
| CA | 43 | 3 | FL | 10 | |
| PA | 12 | NC | 6 | ||
| NY | 11 | TN | 6 | ||
| IL | 10 |
117th:
370 bills proposed in 1st 1/2 of the 117th and 165 in the 2nd 1/2. Democrats had 11 bills advance into laws and GOP had 2 bills advance.
| 117th | 117th | ||||
| DEM: State | DEM: # Bills | DEM: # LAW | GOP: State | GOP: # Bills | GOP: # LAW |
| CA | 29 | 4 | FL | 7 | 1 |
| NY | 9 | IL | 4 | 1 | |
| MI | 7 | 1 | AZ | 4 | |
| NH | 6 |
The 118th Congress is still ‘active’ at this time and will end December 31st 2024. At that point in time I will be collecting the remaining data needed to complete the book. I will update this page to reflect the numbers for the 118th Congress.
Why are these numbers important? It clearly shows which party from which state proposes many bills in the 2nd half of each Congress, which further floods the Committee docket and causes vital bills to die off. Their statistics are public record and I am bringing those numbers forward.
